12 KiB
| title | date | slug | url |
|---|---|---|---|
| Monitoring Kubernetes with Sysdig | 2015-11-19 | monitoring-kubernetes-with-sysdig | /blog/2015/11/Monitoring-Kubernetes-With-Sysdig |
Today we’re sharing a guest post by Chris Crane from Sysdig about their monitoring integration into Kubernetes.
Kubernetes offers a full environment to write scalable and service-based applications. It takes care of things like container grouping, discovery, load balancing and healing so you don’t have to worry about them. The design is elegant, scalable and the APIs are a pleasure to use.
And like any new infrastructure platform, if you want to run Kubernetes in production, you’re going to want to be able to monitor and troubleshoot it. We’re big fans of Kubernetes here at Sysdig, and, well: we’re here to help.
Sysdig offers native visibility into Kubernetes across the full Sysdig product line. That includes sysdig, our open source, CLI system exploration tool, and Sysdig Cloud, the first and only monitoring platform designed from the ground up to support containers and microservices.
At a high level, Sysdig products are aware of the entire Kubernetes cluster hierarchy, including namespaces, services, replication controllers and labels. So all of the rich system and application data gathered is now available in the context of your Kubernetes infrastructure. What does this mean for you? In a nutshell, we believe Sysdig can be your go-to tool for making Kubernetes environments significantly easier to monitor and troubleshoot!
In this post I will quickly preview the Kubernetes visibility in both open source sysdig and Sysdig Cloud, and show off a couple interesting use cases. Let’s start with the open source solution.
Exploring a Kubernetes Cluster with csysdig
The easiest way to take advantage of sysdig’s Kubernetes support is by launching csysdig, the sysdig ncurses UI:
> csysdig -k http://127.0.0.1:8080
*Note: specify the address of your Kubernetes API server with the -k command, and sysdig will poll all the relevant information, leveraging both the standard and the watch API.
Now that csysdig is running, hit F2 to bring up the views panel, and you'll notice the presence of a bunch of new views. The k8s Namespaces view can be used to see the list of namespaces and observe the amount of CPU, memory, network and disk resources each of them is using on this machine:
Similarly, you can select k8s Services to see the same information broken up by service:
or k8s Controllers to see the replication controllers:
or k8s Pods to see the list of pods running on this machine and the resources they use:
Drill Down-Based Navigation
A cool feature in csysdig is the ability to drill down: just select an element, click on enter and – boom – now you're looking inside it. Drill down is also aware of the Kubernetes hierarchy, which means I can start from a service, get the list of its pods, see which containers run inside one of the pods, and go inside one of the containers to explore files, network connections, processes or even threads. Check out the video below.
Actions!
One more thing about csysdig. As recently announced, csysdig also offers “control panel” functionality, making it possible to use hotkeys to execute command lines based on the element currently selected. So we made sure to enrich the Kubernetes views with a bunch of useful hotkeys. For example, you can delete a namespace or a service by pressing "x," or you can describe them by pressing "d."
My favorite hotkeys, however, are "f," to follow the logs that a pod is generating, and "b," which leverages kubectl exec to give you a shell inside a pod. Being brought into a bash prompt for the pod you’re observing is really useful and, frankly, a bit magic. :-)
So that’s a quick preview of Kubernetes in sysdig. Note though, that all of this functionality is only for a single machine. What happens if you want to monitor a distributed Kubernetes cluster? Enter Sysdig Cloud.
Monitoring Kubernetes with Sysdig Cloud
Let’s start with a quick review of Kubernetes’ architecture. From the physical/infrastructure point of view, a Kubernetes cluster is made up of a set of minion machines overseen by a master machine. The master’s tasks include orchestrating containers across minions, keeping track of state and exposing cluster control through a REST API and a UI.
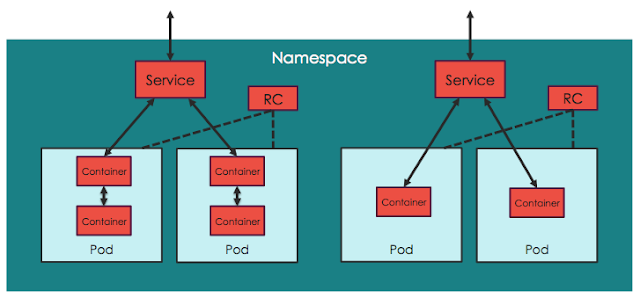
On the other hand, from the logical/application point of view, Kubernetes clusters are arranged in the hierarchical fashion shown in this picture:
- All containers run inside pods. A pod can host a single container, or multiple cooperating containers; in the latter case, the containers in the pod are guaranteed to be co-located on the same machine and can share resources.
- Pods typically sit behind services , which take care of balancing the traffic, and also expose the set of pods as a single discoverable IP address/port.
- Services are scaled horizontally by replication controllers (“RCs”) which create/destroy pods for each service as needed.
- Namespaces are virtual clusters that can include one or more services.
So just to be clear, multiple services and even multiple namespaces can be scattered across the same physical infrastructure.
After talking to hundreds of Kubernetes users, it seems that the typical cluster administrator is often interested in looking at things from the physical point of view, while service/application developers tend to be more interested in seeing things from the logical point of view.
With both these use cases in mind, Sysdig Cloud’s support for Kubernetes works like this:
- By automatically connecting to a Kubernetes’ cluster API Server and querying the API (both the regular and the watch API), Sysdig Cloud is able to infer both the physical and the logical structure of your microservice application.
- In addition, we transparently extract important metadata such as labels.
- This information is combined with our patent-pending ContainerVision technology, which makes it possible to inspect applications running inside containers without requiring any instrumentation of the container or application. Based on this, Sysdig Cloud can provide rich visibility and context from both an infrastructure-centric and an application-centric point of view. Best of both worlds! Let’s check out what this actually looks like.
One of the core features of Sysdig Cloud is groups, which allow you to define the hierarchy of metadata for your applications and infrastructure. By applying the proper groups, you can explore your containers based on their physical hierarchy (for example, physical cluster > minion machine > pod > container) or based on their logical microservice hierarchy (for example, namespace > replication controller > pod > container – as you can see in this example).
If you’re interested in the utilization of your underlying physical resource – e.g., identifying noisy neighbors – then the physical hierarchy is great. But if you’re looking to explore the performance of your applications and microservices, then the logical hierarchy is often the best place to start.
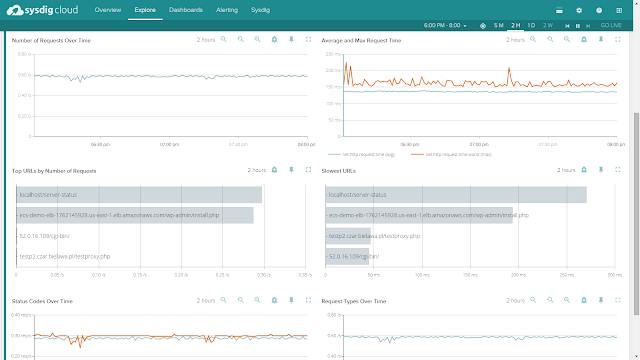
For example: here you can see the overall performance of our WordPress service:
Keep in mind that the pods implementing this service are scattered across multiple machines, but we can still total request counts, response times and URL statistics aggregated together for this service. And don’t forget: this doesn’t require any configuration or instrumentation of wordpress, apache, or the underlying containers!
And from this view, I can now easily create alerts for these service-level metrics, and I can dig down into any individual container for deep inspection - down to the process level – whenever I want, including back in time!
Visualizing Your Kubernetes Services
We’ve also included Kubernetes awareness in Sysdig Cloud’s famous topology view, at both the physical and logical level.
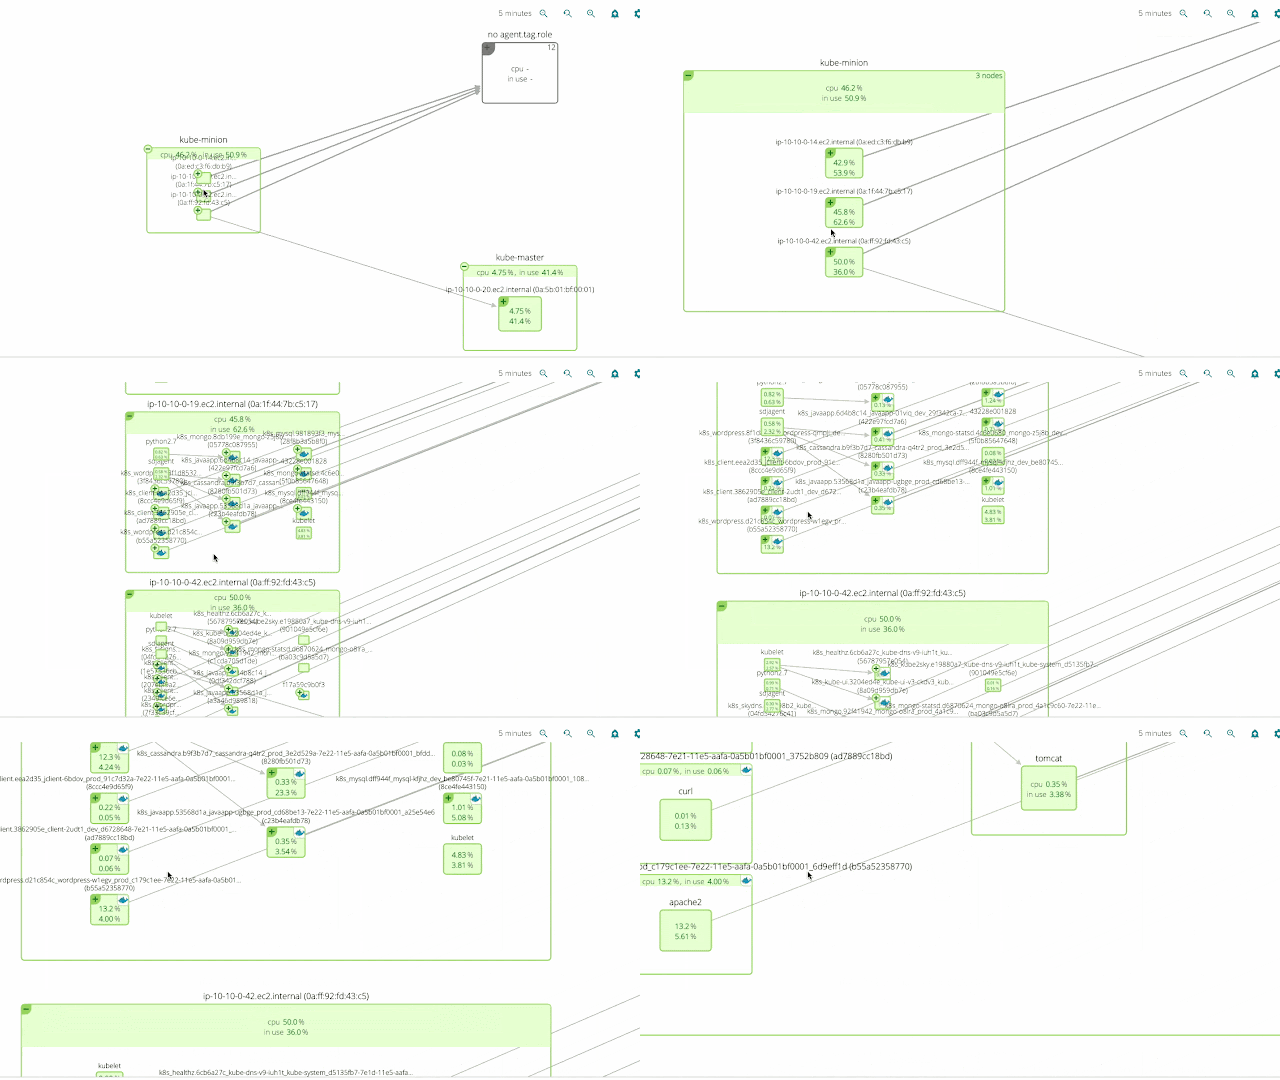
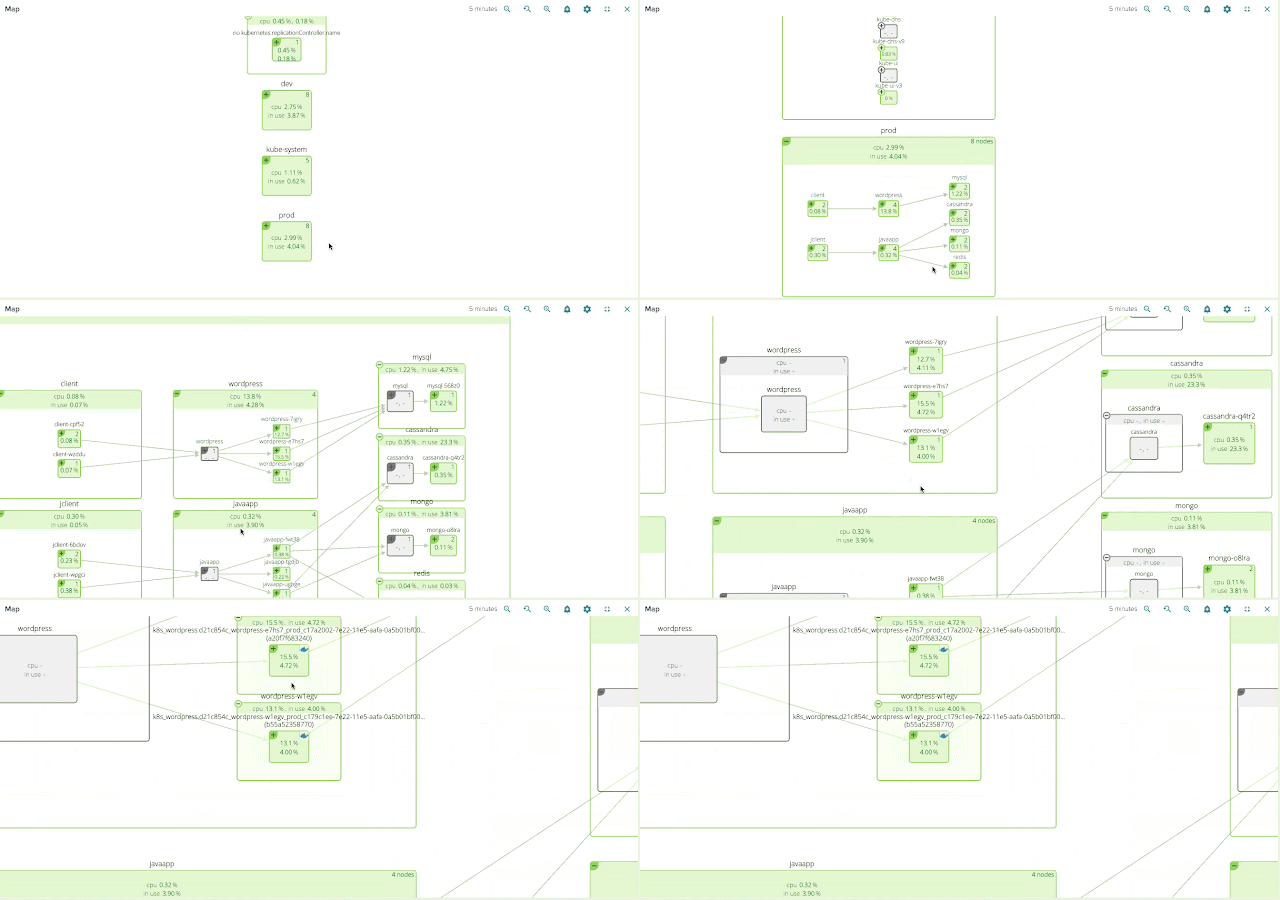
The two pictures below show the exact same infrastructure and services. But the first one depicts the physical hierarchy, with a master node and three minion nodes; while the second one groups containers into namespaces, services and pods, while abstracting the physical location of the containers.
Hopefully it’s self-evident how much more natural and intuitive the second (services-oriented) view is. The structure of the application and the various dependencies are immediately clear. The interactions between various microservices become obvious, despite the fact that these microservices are intermingled across our machine cluster!
Conclusion
I’m pretty confident that what we’re delivering here represents a huge leap in visibility into Kubernetes environments and it won’t disappoint you. I also hope it can be a useful tool enabling you to use Kubernetes in production with a little more peace of mind. Thanks, and happy digging!
Chris Crane, VP Product, Sysdig
You can find open source sysdig on github and at sysdig.org, and you can sign up for free trial of Sysdig Cloud at sysdig.com.
To see a live demo and meet some of the folks behind the project join us this Thursday for a Kubernetes and Sysdig Meetup in San Francisco.


