9.3 KiB
IOx — Profiling
This document explains certain profiling strategies.
Preperation
If you want to profile IOx, make sure to build+run it using an appropriate profile:
- release: This is a production quality binary. Use
cargo run --releaseorcargo build --release(binary is./target/release/influxdb_iox). - quick-release: This comes close to a production-like binary but the build step is not as heavy, allowing you to
iterate faster -- especially after you have found an issue and want to try out improvements). Use
cargo run --profile quick-releaseorcargo build --profile quick-release(binary is./target/quick-release/influxdb_iox). - debug: This is an unoptimized debug binary. It can still be helpful though to figure out why tests (which use the
same profile) take so long. Use
cargo run/cargo run --devorcargo build/cargo build --dev(binary is./target/dev/influxdb_iox).
Note that your concrete test hardware (esp. if is not an x64 CPU or a battery-driven laptop), your operating system (esp. if it is not Linux) and other factors can play a role and may result to different result compared to prod.
If you want to trace memory allocations, you need to disable jemalloc by passing --no-default-features to cargo.
Embedded CPU Profiler
IOx includes an embedded pprof exporter compatible with the go pprof tool.
To use it, aim your favorite tool at your IOx host at the HTTP /debug/pprof/profile endpoint.
Use the Go pprof tool:
Example
go tool pprof 'http://localhost:8080/debug/pprof/profile?seconds=5'
And you get output like:
Fetching profile over HTTP from http://localhost:8080/debug/pprof/profile?seconds=5
Saved profile in /Users/mkm/pprof/pprof.cpu.006.pb.gz
Type: cpu
Entering interactive mode (type "help" for commands, "o" for options)
(pprof) top
Showing nodes accounting for 93, 100% of 93 total
Showing top 10 nodes out of 185
      flat  flat%   sum%        cum   cum%
        93   100%   100%         93   100%  backtrace::backtrace::libunwind::trace
         0     0%   100%          1  1.08%  <&str as nom::traits::InputTakeAtPosition>::split_at_position1_complete
         0     0%   100%          1  1.08%  <(FnA,FnB) as nom::sequence::Tuple<Input,(A,B),Error>>::parse
         0     0%   100%          1  1.08%  <(FnA,FnB,FnC) as nom::sequence::Tuple<Input,(A,B,C),Error>>::parse
         0     0%   100%          5  5.38%  <F as futures_core::future::TryFuture>::try_poll
         0     0%   100%          1  1.08%  <T as alloc::slice::hack::ConvertVec>::to_vec
         0     0%   100%          1  1.08%  <alloc::alloc::Global as core::alloc::Allocator>::allocate
         0     0%   100%          1  1.08%  <alloc::borrow::Cow<B> as core::clone::Clone>::clone
         0     0%   100%          3  3.23%  <alloc::vec::Vec<T,A> as alloc::vec::spec_extend::SpecExtend<T,I>>::spec_extend
         0     0%   100%          1  1.08%  <alloc::vec::Vec<T,A> as core::iter::traits::collect::Extend<T>>::extend
Interactive visualizations
The go tool pprof command can also open an interactive visualization in a web browser page,
that allows you to render a call graph, or a flamegraph or other visualizations, and also search for symbols etc. See:
go tool pprof -http=localhost:6060 'http://localhost:8080/debug/pprof/profile?seconds=30'
Use the built in flame graph renderer
You may not always have the go toolchain on your machine.
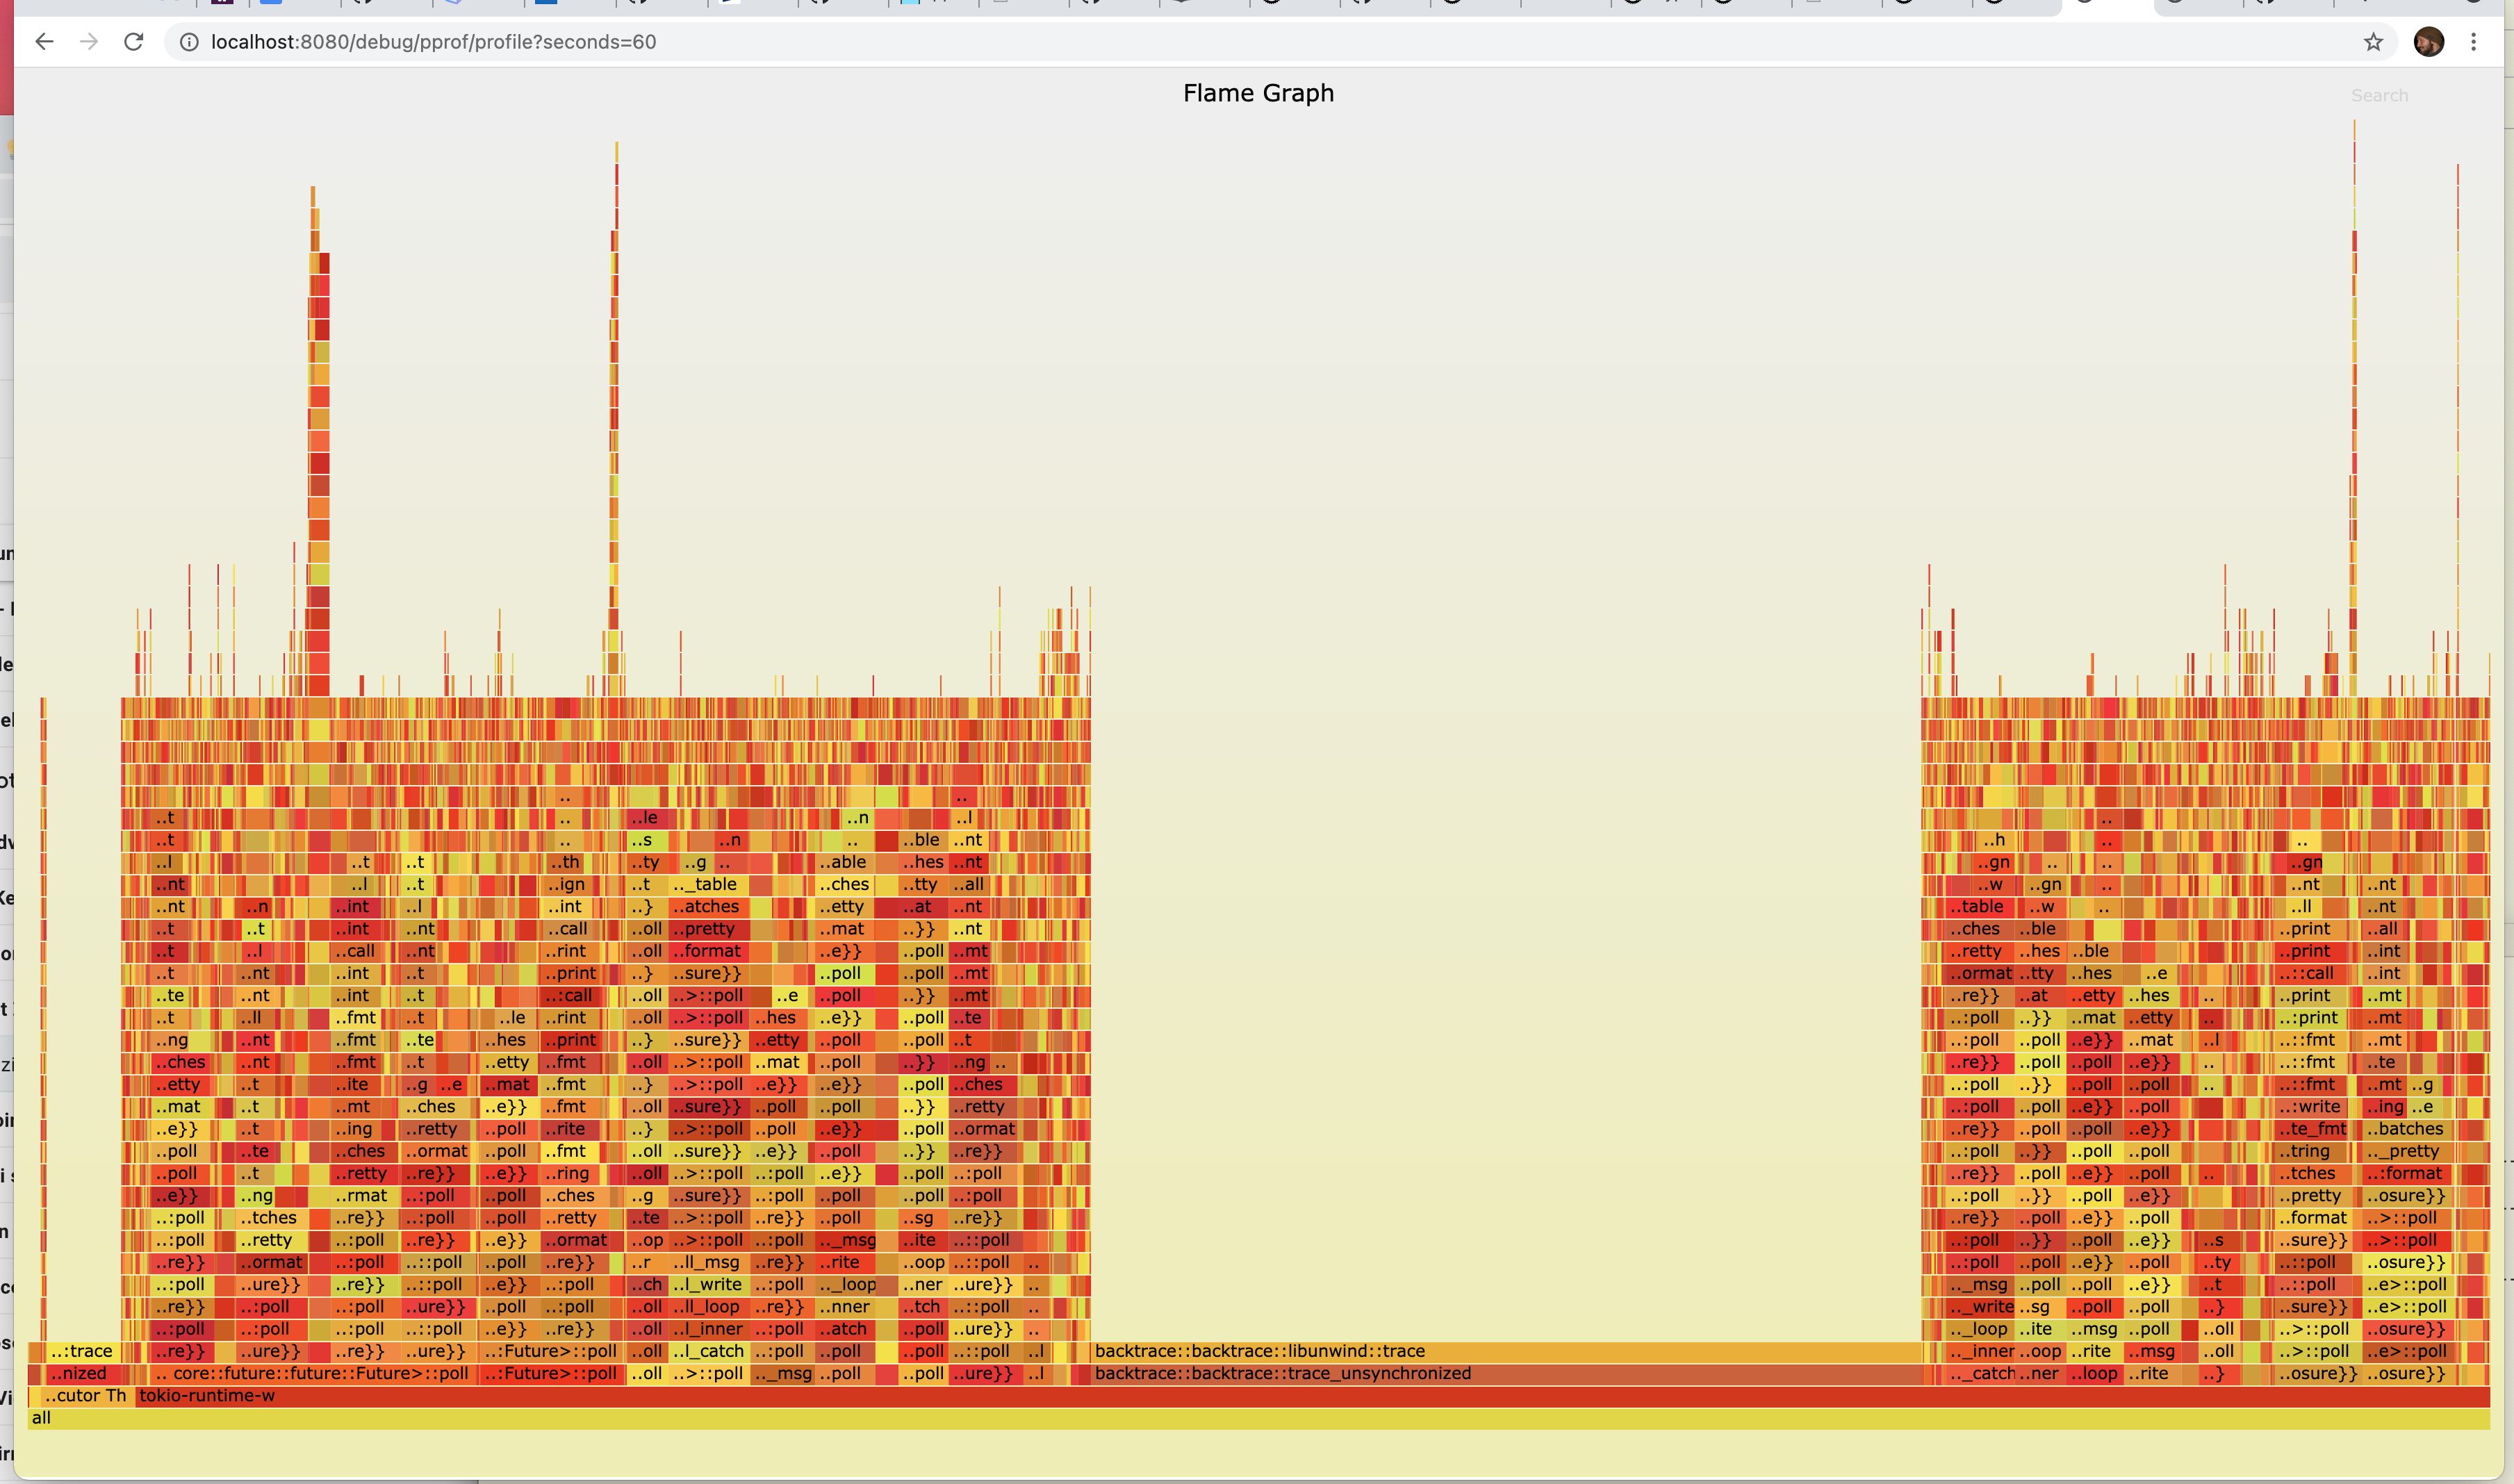
IOx also knows how to render a flamegraph SVG directly if opened directly in the browser:
For example, if you aim your browser at an IOx server with a URL such as http://localhost:8080/debug/pprof/profile?seconds=5
You will see a beautiful flame graph such as
Capture to a file and view afterwards
You can also capture to a file and then view with pprof afterwards
$ # write data to profile.proto
$ curl 'http://localhost:8080/debug/pprof/profile?seconds=30' -o profile.proto

$ # view with pprof tool
$ go tool pprof -http=localhost:6060 profile.proto
Pros & Cons
While the builtin CPU profiler is convenient and can easily be used on a deployed production binary, it may lack certain flexibility and features. Also note that this is a sampling profiler, so you may miss certain events.
Embedded Heap Profiler
IOx includes a memory heap profile tool as well as a CPU profiler. The memory usage tool is based on heappy.
Support is is not compiled in by default, but must be enabled via the heappy feature:
# Compile and run IOx with heap profiling enabled
cargo run --no-default-features --features=heappy  -- run all-in-one
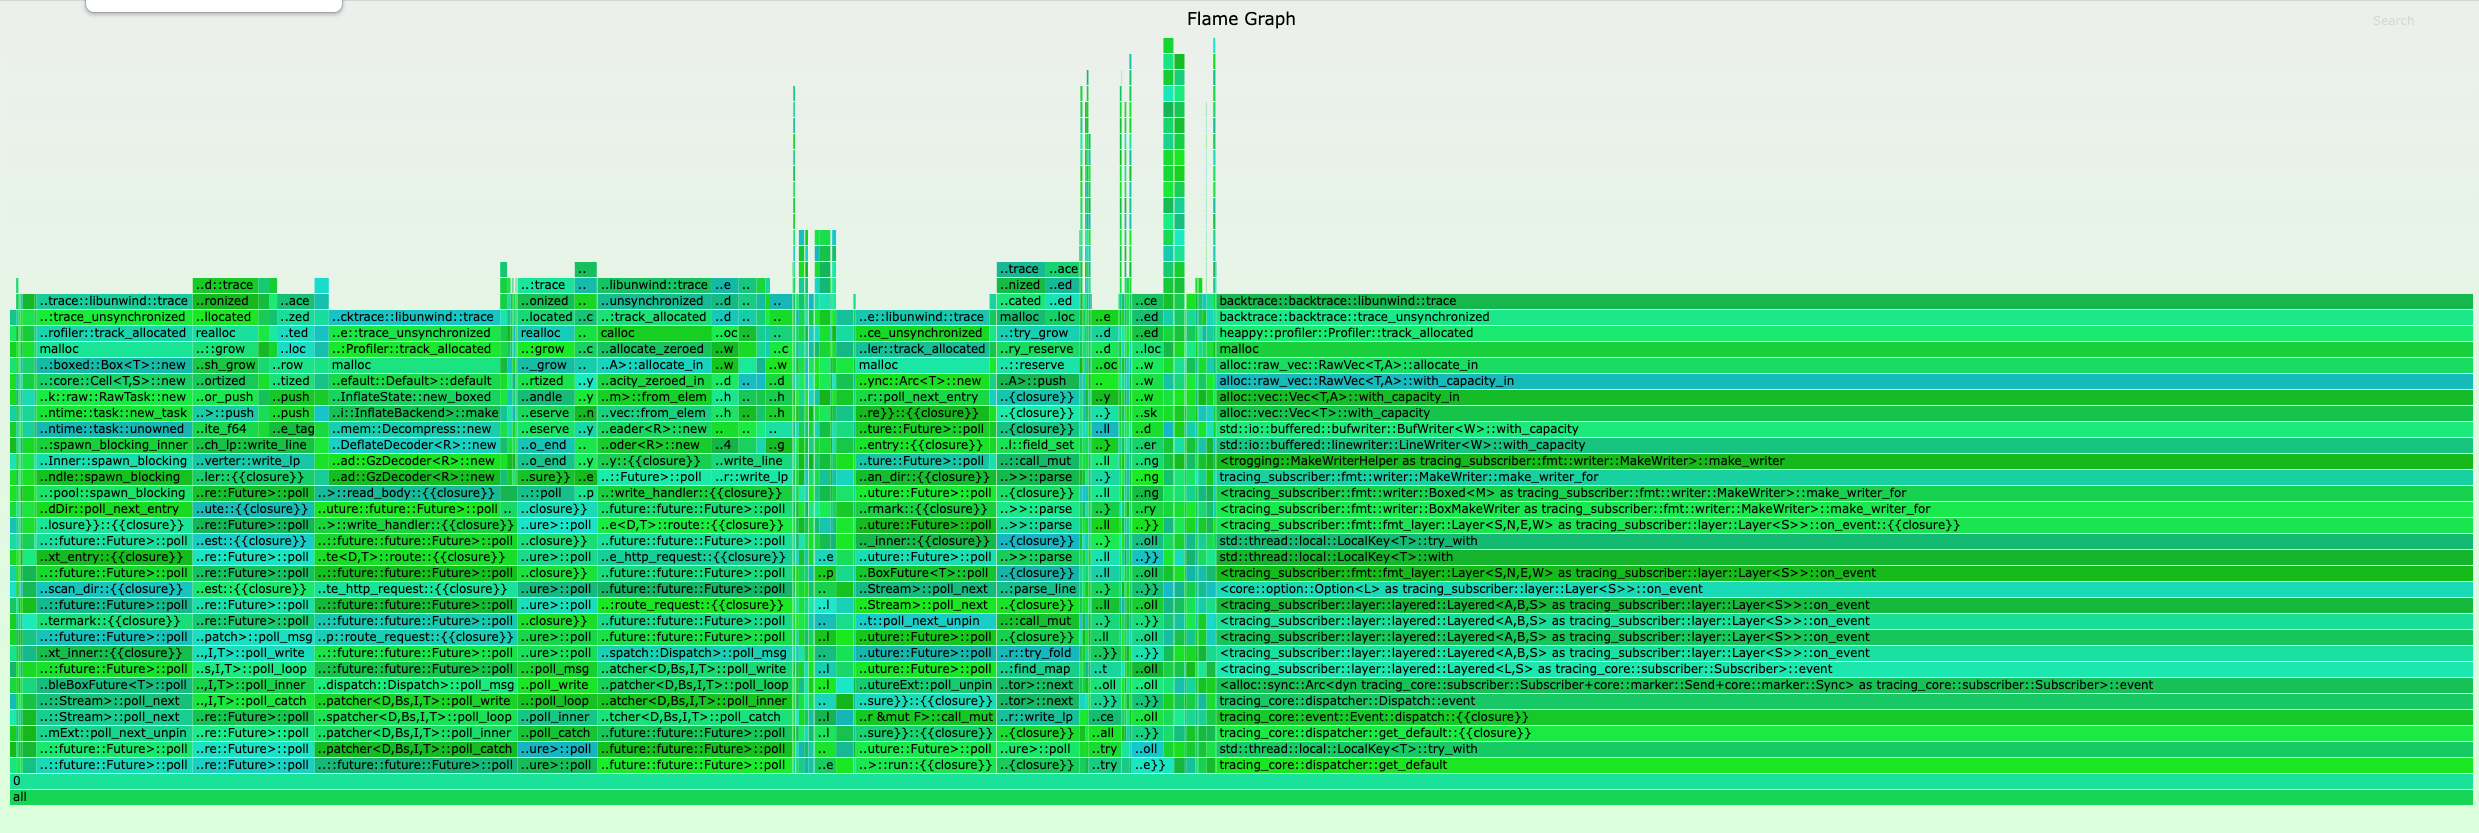
Now, you aim your browser at an IOx server with a URL such as http://localhost:8080/debug/pprof/allocs?seconds=5
You will see a green flamegraph such as
Pros & Cons
Heappy is probably the easiest way to profile memory, but due to its simple nature its output is limited (e.g. it is hard to track "wandering" allocations that are created in one and de-allocated in another place).
cargo-flamegraph
You can use cargo-flamegraph which is an all-in-one solution to create flamegraphs for production binaries, tests, and benchmarks.
perf + Speedscope (Linux only)
While cargo-flamegraph is nice and simple, sometimes you need more control over the profiling or want to use a
different viewer. For that, install cargo-with and make sure you have perf installed. To profile a specific test,
e.g. test_cases_delete_three_delete_three_chunks_sql in query_tests:
$ # cargo-with requires you to change the CWD first:
$ cd query_tests
$ cargo with 'perf record -F99 --call-graph dwarf -- {bin}' -- test -- test_cases_delete_three_delete_three_chunks_sql
$ perf script > perf.txt
Now to to speedscope.app and upload perf.txt to view the profile.
Advanced perf (Linux only)
perf has loads of other tricks, e.g. syscall counting. So imagine after some profiling we figured out that our
test is using too many getrandom calls. Now we can can first use perf to generate a profile for that specific
syscall. Make sure you have cargo-with installed and run:
$ # cargo-with requires you to change the CWD first:
$ cd query_tests
$ cargo with 'perf record -e syscalls:sys_enter_getrandom --call-graph dwarf -- {bin}' -- test -- test_cases_delete_three_delete_three_chunks_sql
and then we can generate a callgraph using gprof2dot:
$ perf script | gprof2dot --format=perf | dot -Tsvg > perf.svg
heaptrack (Linux only)
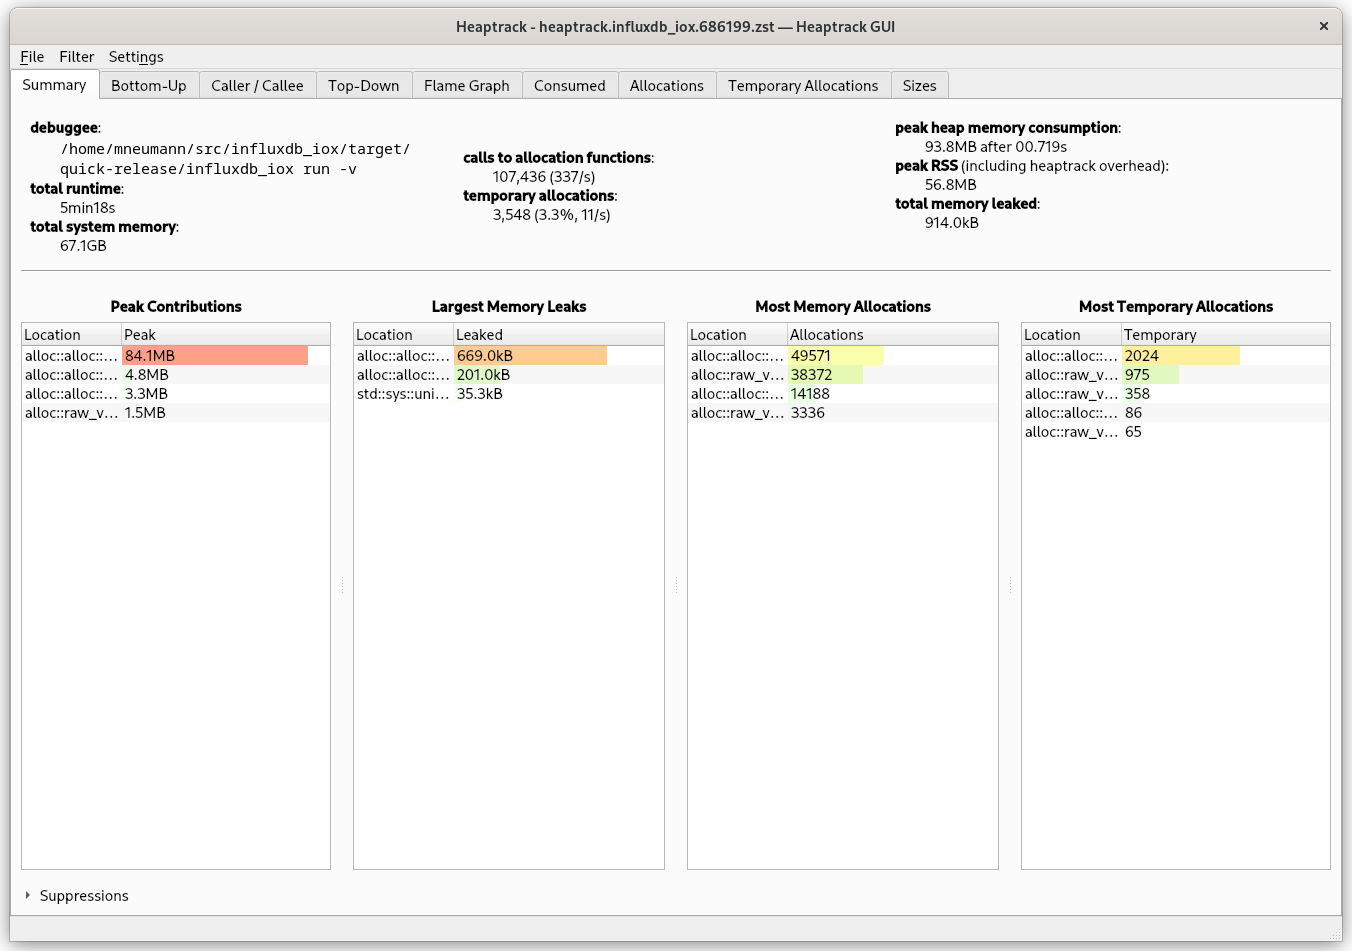
heaptrack is a quite fast and accurate way to profile heap allocations under Linux. It works with Rust applications to. Install heaptrack and cargo-with and run:
$ cargo with 'heaptrack' -- run --profile=quick-release --no-default-features -- run -v
Note the --no-default-features flag which will disable jemalloc so that heaptrack can inspect memory allocations.
After the program exists, the heaptrack GUI will spawn automatically:
bpftrace (Linux only)
You may use even more advanced tools like bpftrace to trace about any aspect of the operating system. Install
bpftrace and cargo-with, then create a tracing script in program.txt:
tracepoint:syscalls:sys_exit_read /pid == cpid/ { @bytes = hist(args->ret); }
This example will produce a histogram of all sizes returned by the read syscall:
$ cargo with "sudo bpftrace -c {bin} program.txt" -- run --profile=quick-release
    Finished quick-release [optimized + debuginfo] target(s) in 0.20s
Attaching 1 probe...
^C[influxdb_iox/src/main.rs:327]


@bytes:
[0]                    1 |@@@@@@@@@@@@@                                       |
[1]                    1 |@@@@@@@@@@@@@                                       |
[2, 4)                 0 |                                                    |
[4, 8)                 1 |@@@@@@@@@@@@@                                       |
[8, 16)                1 |@@@@@@@@@@@@@                                       |
[16, 32)               1 |@@@@@@@@@@@@@                                       |
[32, 64)               0 |                                                    |
[64, 128)              1 |@@@@@@@@@@@@@                                       |
[128, 256)             0 |                                                    |
[256, 512)             0 |                                                    |
[512, 1K)              4 |@@@@@@@@@@@@@@@@@@@@@@@@@@@@@@@@@@@@@@@@@@@@@@@@@@@@|
[1K, 2K)               2 |@@@@@@@@@@@@@@@@@@@@@@@@@@                          |
WARNING: Due to the sudo hack, only use this for trusted programs!


