3.9 KiB
Distributed Tracing in IOx
Not to be confused with the Rust tracing ecosystem, which we use for logging, distributed tracing refers to ability to capture information about where time is spent during a given transaction, potentially across service boundaries
Components
Trace (trace)
The trace crate contains the data model for distributed tracing and nothing else. It is an intentionally lightweight
dependency, as it is needed by any code that wishes to produce trace spans.
Trace HTTP (trace_http)
The trace_http crate contains the logic to extract context information from HTTP requests, and use this to produce
Spans. This takes the form of a tower layer called TraceLayer that attaches the SpanContext of this generated
newly Span to the Request as an extension. This can then be accessed downstream and used to create new child spans.
async fn handle_request(req: Request<Body>) {
    // Get SpanContext if this request is sampled
    let maybe_span_ctx: Option<&SpanContext> = req.extensions().get();

    // Create a new span
    let maybe_span = maybe_span_ctx.map(|x| x.child("foo"));

    // Create a recorder that will record start and end times
    let recorder = SpanRecorder::new(maybe_span);
}
Trace Exporters (trace_exporters)
The trace_exporters crate contains the logic to sink traces to upstream aggregators such as Jaeger. In the future,
we may also add OTLP in order to allow using OpenTelemetry Collector to fanout to different aggregators
Running Jaeger / tracing locally
To use, develop, or debug the distributed tracing functionality locally you can do the following:
Step 1: Run Jaeger locally
Follow instructions from https://www.jaegertracing.io/docs/1.26/getting-started/, which at the time of writing were (simplified to what IOx needs):
docker run -d --name jaeger \
  -p 6831:6831/udp \
  -p 16686:16686 \
  jaegertracing/all-in-one:1.26
Step 2: Run IOx configured to send traces to the local Jaeger instance
Build IOx and run with the following environment variable set:
TRACES_EXPORTER=jaeger
TRACES_EXPORTER_JAEGER_AGENT_HOST=localhost
TRACES_EXPORTER_JAEGER_AGENT_PORT=6831
For example, a command such as this should do the trick:
TRACES_EXPORTER=jaeger TRACES_EXPORTER_JAEGER_AGENT_HOST=localhost TRACES_EXPORTER_JAEGER_AGENT_PORT=6831 cargo run -- run all-in-one -v
Additional trace granularity, in particular traces with spans for each DataFusion partition, can be enabled with
INFLUXDB_IOX_PER_PARTITION_TRACING=1
Some tracing setups may struggle with the size of the generated traces with this setting enabled.
Step 3: Send a request with trace context
For IOx to emit traces, the request must have a span context set. You can use the --header flag on the IOx CLI to do
so. For example
$ # load data
$ curl -v "http://127.0.0.1:8080/api/v2/write?org=26f7e5a4b7be365b&bucket=917b97a92e883afc" --data-binary @tests/fixtures/lineproto/metrics.lp

$ # run a query and start a new trace
$ cargo run -- query 26f7e5a4b7be365b_917b97a92e883afc  'show tables' --gen-trace-id
Step 4: Explore Spans in the UI
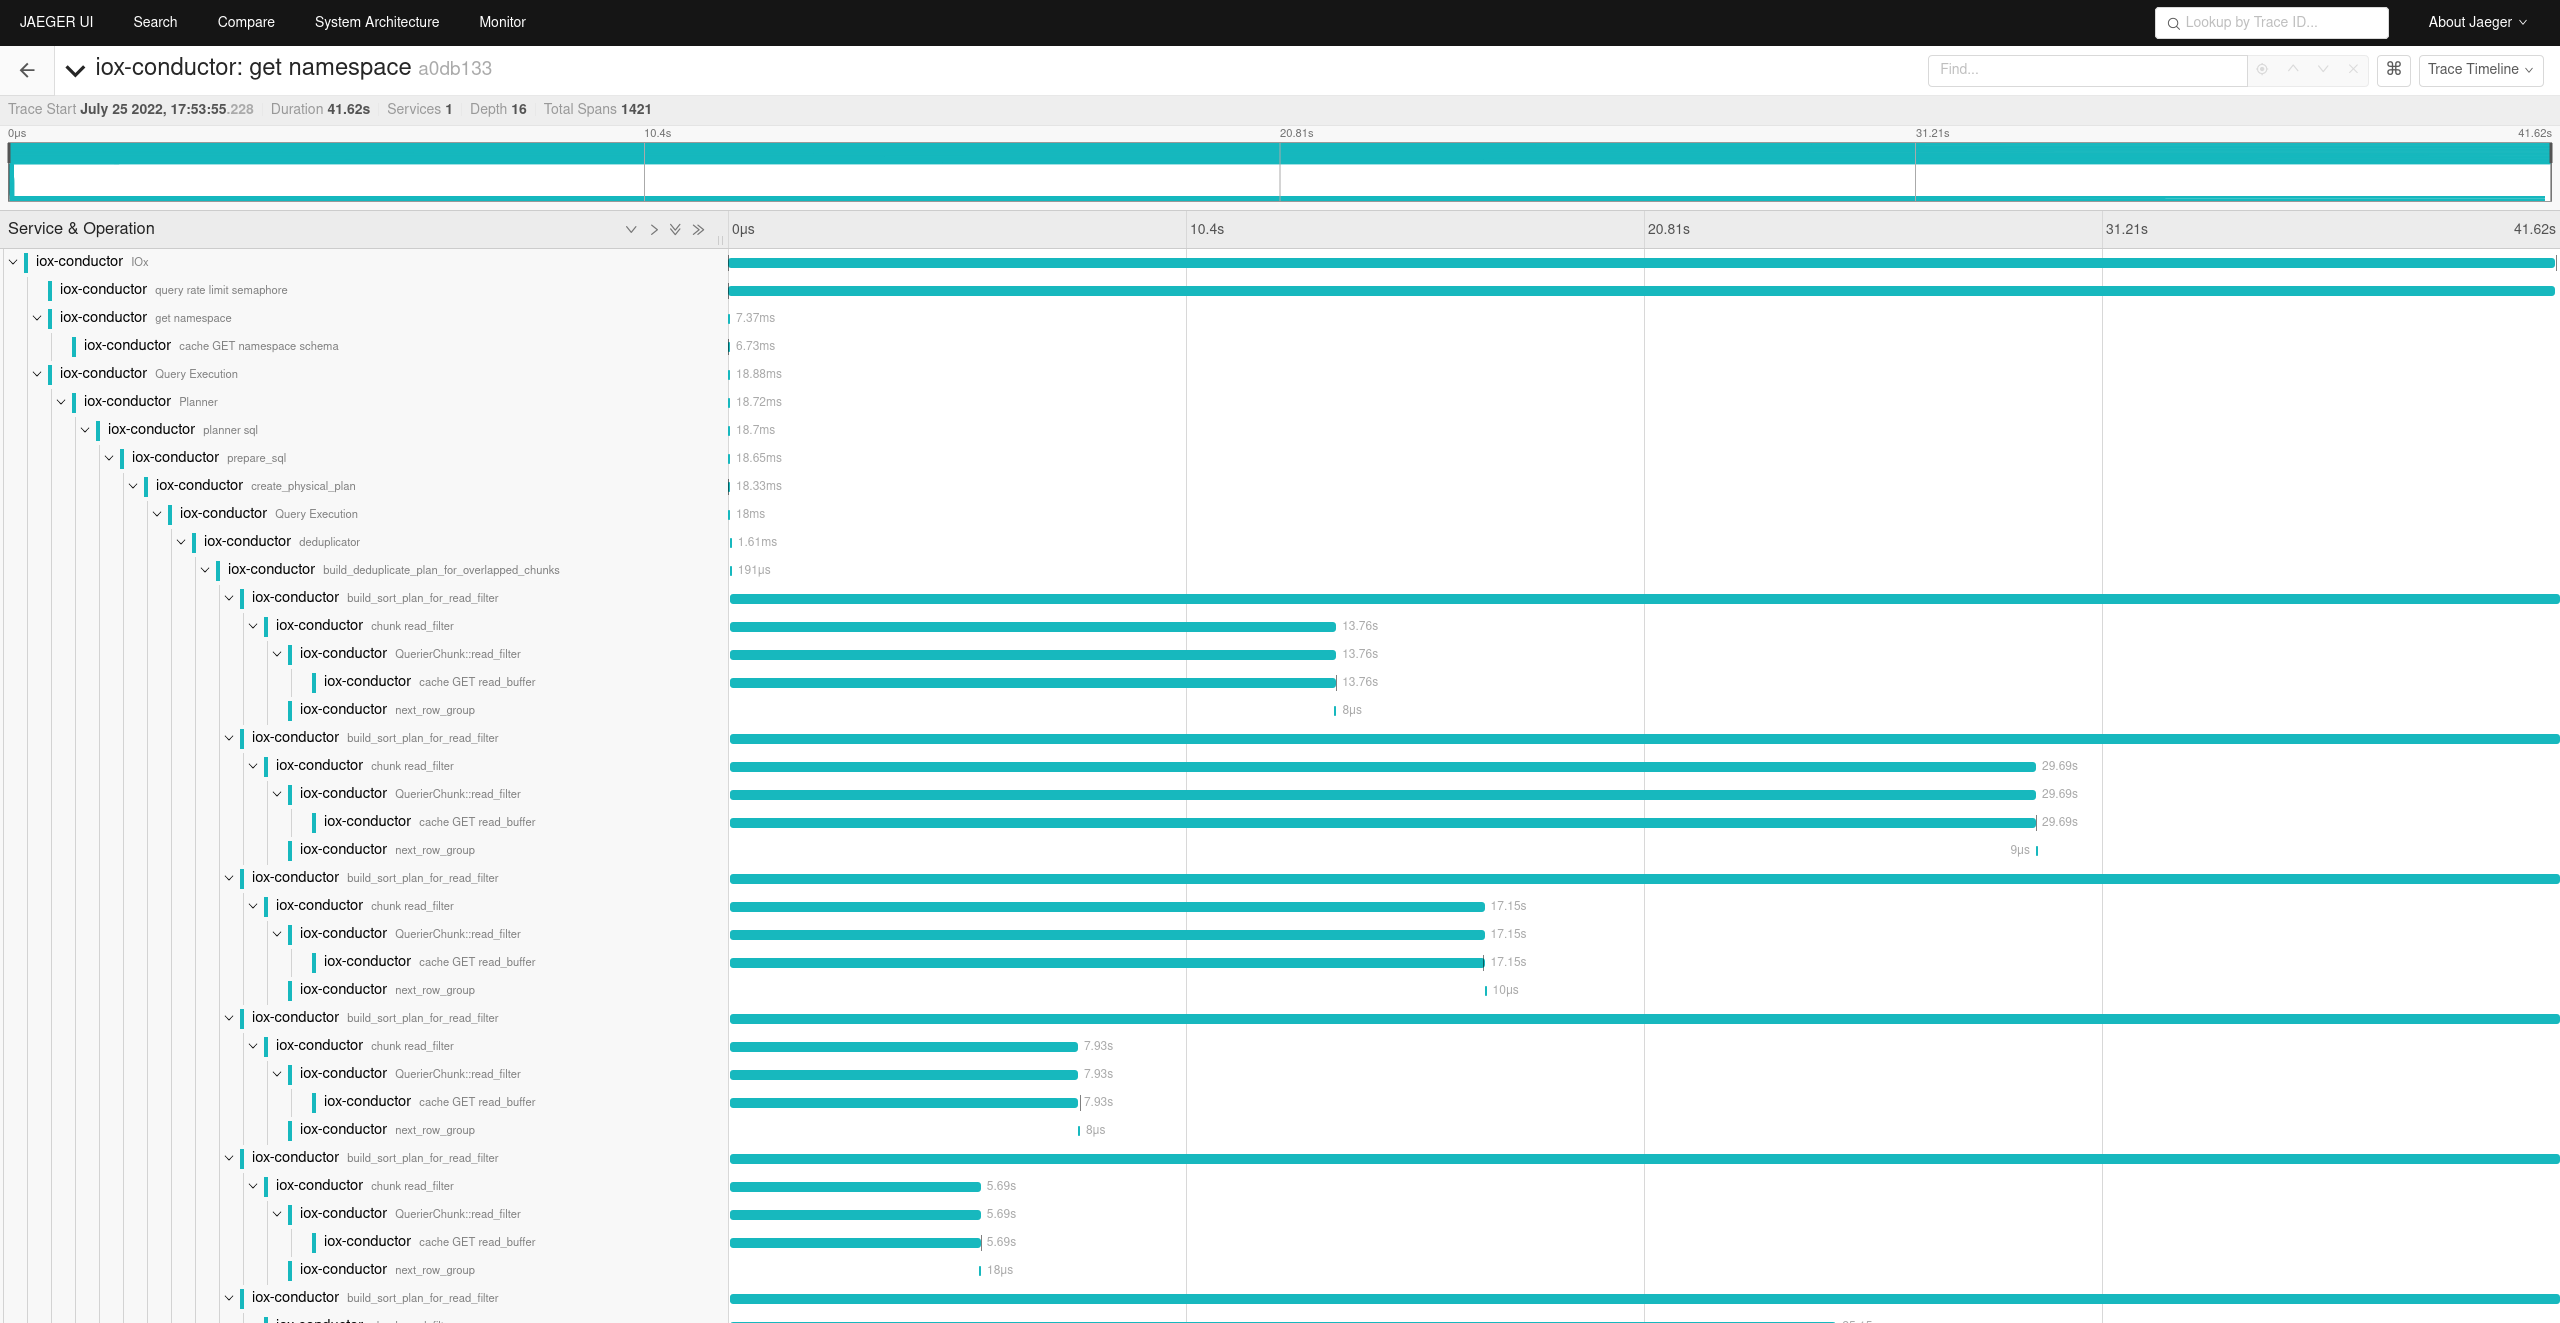
Navigate to the UI in your browser localhost:16686/search and then chose the "iox-conductor" service from the drop down:
You can then inspect the individual traces:

